From generative AI use to the rise of autonomous agents, he sales enablement landscape is evolving faster than ever. These sales enablement statistics shine a light on not just trends, but the foundational shifts that will separate traditional enablement from tomorrow’s AI-powered revenue engines.
The enablement landscape is evolving faster than most organizations can adapt. According to Flowla’s , 64% of organizations now say their enablement strategy spans all revenue teams but fewer than one in four describe themselves as truly unified and AI-powered.It’s a telling signal: enablement is broadening, but not yet maturing.
Meanwhile, traditional without enforcing content hygiene or change management will fall short while vertical, domain-aware AI systems that orchestrate, govern, and embed enablement logic are becoming the differentiator.
Let these sales enablement statistics help you build a better sales enablement strategy.
General Sales Enablement Statistics
Let’s dive into some general enablement statistics affecting today’s businesses:
1. 90% of organizations have a dedicated sales enablement team or program.
The found that the number of businesses with a dedicated sales enablement team has grown to 90%, up from 75% in 2022.
2. Sales leaders still aren’t logging into their enablement platforms.
75% of sales leaders logged in to their enablement platform fewer than five times in the last three months, while a whopping 16% haven't log in at all.
3. Revenue teams using AI are growing nearly 30% faster than those that aren’t.
Revenue organizations that adopted AI in 2024 reported 29% higher sales growth than their peers without AI, according to Gong’s .
4. But, only about 20.8% of companies have reached "Revenue Enablement 2.0"
Despite AI adoption accelerating, the found that only about 20.8% of companies have reached “Revenue Enablement 2.0” — a unified, AI-powered, and signal-led model. The rest remain split between traditional training programs and manual, seller-heavy processes that can’t keep pace with modern buyers.
5. An average of 11 stakeholders are involved in B2B purchase decisions.
While 11 is the involved, that number can sometimes go as high as 20.
6. The average sales rep has 2,080 hours per year to sell.
However, research shows that the they spend per year selling is 690 hours—or just 13 hours per week.
Sales Enablement Technology and AI Statistics
Let’s dive into the sales enablement tech stack and how it’s affecting businesses today.
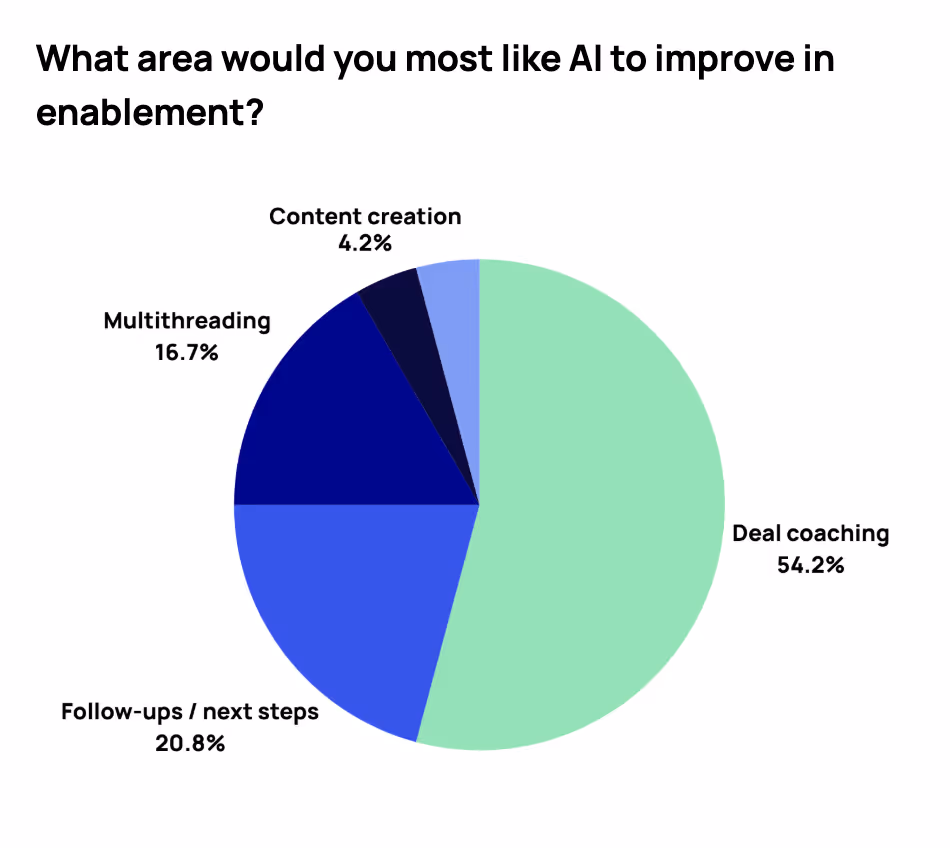
7. 55% of enablement leaders said AI could help most with Deal Coaching and Insights
Interestingly, when asked where AI could help most, ," surfacing the right stakeholders, prompting next steps, and helping reps prioritize. Fewer than 20% wanted AI to automatically draft follow-ups, underscoring that enablement leaders want intelligence that guides reps, not replaces them.
8. Reps are actively embracing AI to work smarter.
now edit AI-generated content, 87% report increased AI usage through tool integrations, and 40% say AI saves them at least one hour every week.
9. AI adoption in sales has more than doubled in just two years.
What was once experimental is now essential. In only two years, AI adoption in sales has skyrocketed from .
10. Nearly half of organizations say AI is already boosting revenue performance.
say AI has already boosted revenue; 51% say it has shortened sales cycles; 44% report reduced onboarding time.
11. Companies using sales enablement tools are 19% more likely to see an increase in their average win rate year over year.
If you’re looking to boost your quota attainment, that sales enablement tools can be a significant help. For example, şÚÁĎłÔąĎÍř users see an average of 20% higher quota attainment.
Learn more about şÚÁĎłÔąĎÍř‍
12. Nearly 70% of sales reps say they’re overwhelmed by the number of tools they need to use to close deals.
According to , sales teams use an average of 10 tools to close deals, which salespeople report feeling overwhelmed about using. In response, 94% of sales organizations plan to consolidate their tech stacks to boost productivity.
Sales Reps' Productivity Statistics
Sales enablement has far-reaching effects. These sales enablement statistics dive into sales productivity.
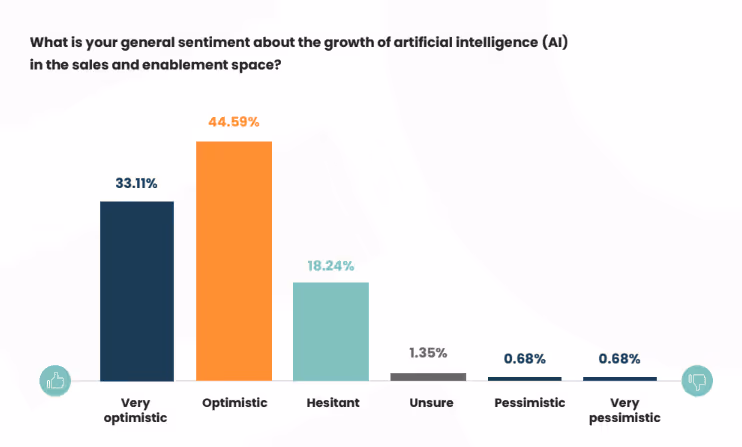
13. 77.7% of enablement professionals are excited about how AI can boost sales performance.
According to the , 44.59% of enablement professionals are “optimistic” about what AI can do for the productivity of sales reps. 33.11% are “very optimistic.”
‍
14. Productivity, not content, is the #1 priority for enablement teams in 2026
What’s top of mind for enablement leaders going into 2026? Not “more content.” , productivity is now the number one priority for enablement teams, signaling a shift from content creation to performance execution.
15. Only 28% of salespeople expect to hit their annual quota.
Many sales reps don’t believe quota attainment is fully possible, with less than 30% saying they expect to . 34% think they will hit between 76% and 99%, whereas another 38% say they’ll hit 75% or less.
16. Sales reps only spend 28% of their week actually selling.
With salespeople spending , a significant goal of sales enablement becomes giving sales reps back their time and allowing them to focus on relationship building and prospecting.

17. 49% of salespeople frequently hit their quota.
şÚÁĎłÔąĎÍř found that while 28% of sales professionals always hit their quota, 49% say they frequently reach full quota attainment. 15% say they sometimes do, while 8% say they never do.
18. Low-performing sales reps are five times more likely than top performers to say they aren’t fully onboarded and productive in their roles after one year.
54% of top performers, however, say they were onboarded and productive within the first three months, compared to just 30% of poor performers.Ěý
Sales Content Statistics
Sales content may have more of an effect than you realize. These sales enablement statistics dive into sales content and its impact on the sales process.
19. Content adoption is the most common metric used to measure the performance of a sales enablement team.
50% of sales enablement professionals say the most common metric used to is the adoption of sales content. Other commonly used metrics include win rates, quota attainment, and sales cycle length.
20. Half of organizations aren’t confident they know what content engages a buyer
While half of all businesses don’t know what kind of content their buyer wants to see, organizations that understand are 38% less likely to struggle with sales velocity.
Pro Tip: With ł§±č±đ°ěľ±łŮ’s AI-powered content recommendations, sales reps will get the content their buyers want to see sent directly to them—wherever they are in their workflow.‍
21. 65% of sales and marketing content go unused.
, 65% of content marketing assets are unused—primarily due to misalignment between the sales and marketing teams. A content management system can help create better alignment and ensure sales teams have access to the content they need, while content analytics can help you figure out what content is being used the most.
22. 41% of respondents say that producing high-quality content is the biggest challenge to creating sales and marketing content.
Meanwhile, 20% say they can’t , while 18% say their budget for creating content is too low.
23. 71% of consumers expect personalization, and 76% are more likely to purchase from brands that personalize.
76% of consumers even get frustrated when they don’t they want. This indicates how important it is to personalize content, whether that means sending content related to the particular industry the buyer is in, case studies from similar companies, statistics on adoption that target a buyer’s pain points, or something else that tells the buyer you know who they are and what they want to see.ĚýÂ
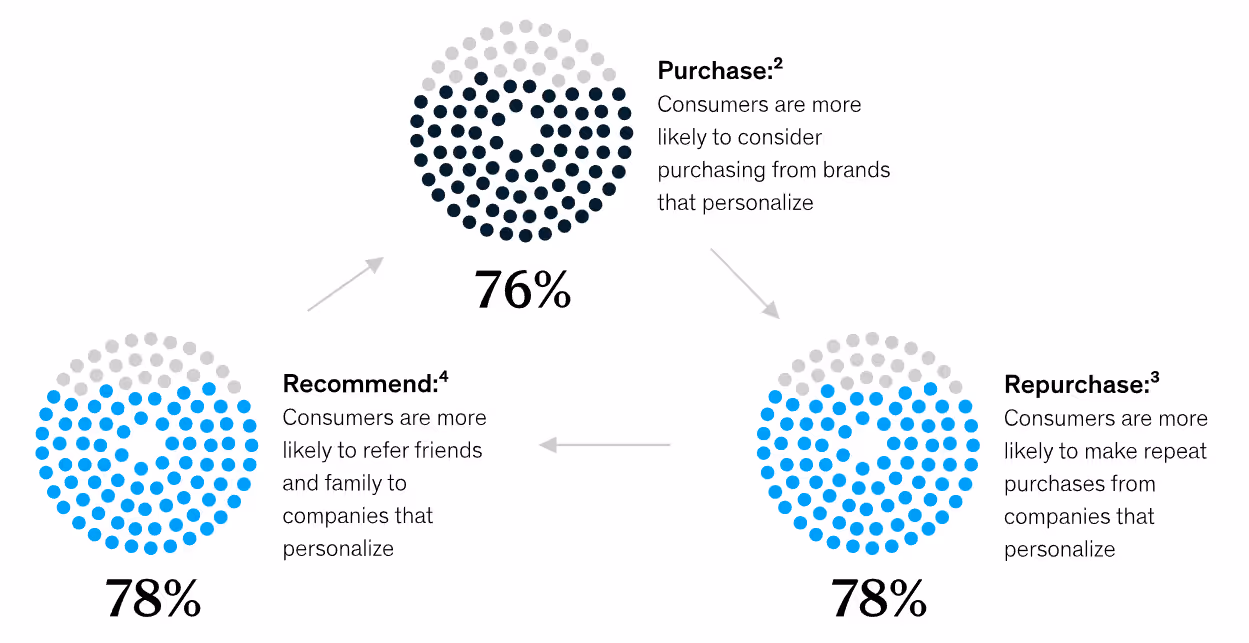
24. 78% of consumers are more likely to recommend a company to a friend if that company personalizes content and interactions.
78% are also more likely to repurchase from a company that , showing how personalization leads to customer acquisition and retention.
Sales Training Statistics
Sales training is a vital part of sales enablement. Let’s unpack today’s sales training landscape.
25. Nearly half of all salespeople think the skills in their current role will be outdated within two to three years.
Gartner found that 49% of sellers are concerned . With the rise of artificial intelligence and automation, that concern may be warranted, and this sales enablement statistic demonstrates the need for continuous training ľ±˛Ôľ±łŮľ±˛ąłŮľ±±ą±đ˛ő.Ěý
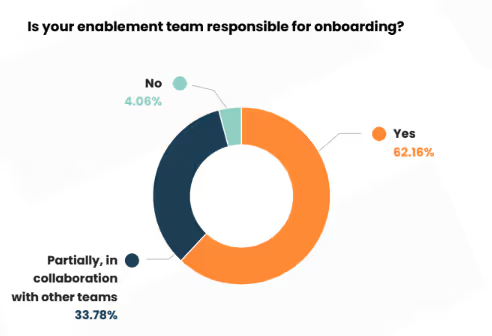
26. 62.18% of sales enablement professionals say their team is responsible for onboarding.
33.78% of say that they are still responsible, but they collaborate with other teams. Only 4.06% said that sales enablement is not involved in onboarding.
27. 53% of sales leaders say they use coaching technology solutions.
While 81% of sales reps say they get , only 53% of sales leaders say they use coaching technology solutions to deliver this training.
28. When using sales play tools, representatives report being 15% more likely to know how to navigate different sales scenarios.
When an employer incorporates , they are shown to be a valuable part of sales training and an effective part of a sales enablement strategy.
29. B2B sales reps forget 70% of their training within one week.
Even if sales reps remember beyond a week, they’re not in the clear. 87% of sales professionals forget all that information within a month, .Ěý
30. Organizations that implement technology for sales training see a 60% average rep quota attainment.
Businesses report a five-percentage-point increase in average rep quota attainment over businesses that don’t use tech for training.Ěý
Consumer Experience Statistics
Enablement goes beyond closing more deals or reaching quota attainment. These sales enablement metrics show how enablement impacts customer loyalty, acquisition, and retention.
31. More than half of all CSOs believe that enablement will support marketing and customer success roles in the next three years.
support the idea that sales enablement and revenue enablement aren’t just about sales. Revenue enablement, in particular, is about not just closing deals but increasing the size of those deals and boosting revenue overall, which affects all customer-facing teams.Ěý
32. 80% of sales reps say maintaining customer relationships after closing a deal is increasingly important.
With more companies saying that they value long-term relationship building over short-term wins, sales reps are turning toward customer retention as , with 92% of high performers saying that they’re at least partially evaluated on post-sale metrics like customer value and retention.
33. 75% of B2B marketers say buyers are taking longer to commit to a purchase than last year.
may be due to the fact that buyers report doing more research before making a purchase, as buyers are becoming more risk-averse.
34. Most buyers are 70% through their buying journey before they talk to a seller.
Most buyers are before they reach out to a salesperson, demonstrating the necessity of sales enablement content at every stage of the sales pipeline.
35. 33% of all buyers desire a seller-free sales experience.
This number increases when discussing younger generations. 44% of millennials prefer not to when making a B2B purchase.
36. B2B buyers with moderate to high levels of uncertainty are 30% less likely to complete a purchase at all.
They are also 42% less likely to compared to those with little or no uncertainty.
Other Sales Enablement Statistics
These additional sales enablement statistics can shine a light on what’s happening in sales enablement today.
37. Nearly half of businesses don’t use data to gain insights or make decisions.Ěý
Research shows that 46% of organizations or make critical decisions, which shows an opportunity for competitors to get ahead in their industry by ensuring that they’re harnessing the power of their data while others fall behind.
38. 69% of salespeople say their job is harder today.
With the majority of salespeople saying due to uncontrollable concerns like inflation and supply chain issues, sales enablement teams must try to be a helpful resource that lessens their load.Ěý
39. Businesses are 45% more likely to improve sales efficiency when organizations have insight into what’s working.
According to the , gaining insight into what’s working in sales, such as through the analytics on sales enablement platforms, fosters alignment in go-to-market teams and boosts the overall sales efficiency of a company.
40. 47% of account executives have left a job due to poor training or a lack of onboarding.
şÚÁĎłÔąĎÍř found that top performers, in particular, respond best to a solid training and onboarding system, as 52% of top performers have left a job due to poor training and onboarding, compared to 30% of their low-performing counterparts.
41. Only 8% of sales leaders say that most of their sales reps stay on for more than one year.Ěý
63% of sales leaders say 74% or less of their sales reps stick around beyond one year, indicating the necessity of a smooth onboarding experience to support this turnover.
42. 70% of top performers say they had a good or excellent onboarding experience.
In comparison, only 15% of poor performers said that they had a good or excellent onboarding experience at their current company.
Sales Enablement Trends to Look Out For
These sales enablement statistics indicate growing trends to look out for this year. Here’s a look at some top trends.
Sales enablement tools that create less work for sales reps
With sales reps saying that their job is harder today, widely thanks to the number of tools they need to close deals, companies are looking to consolidate their tech stack. A that does more and limits the need for more tech is one direction sales leaders are heading.Ěý
Personalization leads to better customer engagement
Consumers say that personalization is necessary to attract their attention today. From personalized sales scripts to customized content, the more personalization a sales enablement team can produce, the more a sales rep can make their sales collateral work for them.
Onboarding moves to everboarding
Sales onboarding experiences can make the difference between a top performer and a poor performer, but with today’s sales reps saying that they’re concerned about reskilling, businesses need to move to everboarding.Ěý
Instead of just one onboarding phase, sales teams can keep reskilling by making the onboarding experience an ongoing part of their sales training.Ěý
The Future of Enablement Is Just-in-Time
If there’s one thing these numbers make clear, it’s this: enablement isn’t broken, it’s buried.
Teams don’t need more content or another dashboard. They need clarity.
They need AI that doesn’t just summarize, but orchestrates.
Today, fewer than one in four organizations describe themselves as unified and AI-powered. That gap is where the next decade’s winners will emerge. Because the future of enablement won’t be defined by the number of tools you have, it’ll be defined by how seamlessly those tools connect to drive action.
That’s why the new era of enablement is .
It’s intelligent, proactive, and rooted in context.
It’s where AI doesn’t replace your reps, it augments them. It guides them to the right message, the right play, the right next step, exactly when it matters most.
With şÚÁĎłÔąĎÍř, enablement finally moves from reactive to predictive.
From fragmented to unified.
From information overload to insight in the flow of work™.
ł§±č±đ°ěľ±łŮ’s AI Sidekick, collaborative Deal Rooms, and Revenue Insights transform how teams learn, share, and sell, turning everyday activity into measurable impact.
Because enablement shouldn’t live in another tab; it should live where work happens.
The organizations that win the next chapter won’t be the ones creating more content.
They’ll be the ones connecting knowledge, AI, and people to move faster than change itself.
şÚÁĎłÔąĎÍř is how they’ll do it. Let us show you how!